Protecting the Environment / Environmental Resources Protection
Environmental Resources Protection
Air Pollution Control
Currently, WNC’s main emission sources of air pollutants are volatile organic compounds (VOCs), such as flux and cleaning agents, used in production processes. From 2021 to 2023, although WNC was not classified as a regulated company under the Air Pollution Control Act, we still regularly estimated and voluntarily disclosed emissions from stationary sources of air pollution described in the Act based on the inspection results and the calculation methods for air pollution fees.
In 2024, due to increased production capacity at the S1 site, we installed air pollution prevention equipment in accordance with relevant regulations to manage VOCs generated during production processes and obtained a Stationary Pollution Source Operating Permit in September 2024. Moving forward, we will continue to reduce the use of VOCs at the source to mitigate the environmental impact of our production processes.
Water Resource Management
WNC is fully aware of the impact of heavy rainfall and droughts caused by extreme weather. To incorporate
SDG 6 into our daily operations, we published a WNC Water Resource Management Policy in 2024. We achieved our water management goals by monitoring water usage and implementing water recycling measures while conducting internal and external audits to ensure compliance with ISO 14001 standards.
Risk Assessment and Management
To understand the level of water resource risk at WNC’s owned or leased assets, we utilize the Aqueduct Water Risk Atlas developed by the World Resources Institute (WRI) to identify baseline overall water risk at each site.
In selecting future scenarios, we used three scenarios (BAU, OPT, and PES) along with variations in short-, mid-, and long-term water stress and obtained nine assessment results. This approach enabled us to identify high-risk areas and adjust our short-term and long-term policies to address water resource challenges under different climate change pathways. A total of 1,755 sites worldwide were included in this assessment, comprising 16 sites owned or leased by WNC and 1,739 supplier sites. According to our assessment results, our China sites, the Mexico site, and subsidiaries in the US, Germany, and the UK are located in high-stress areas. Among the water resources consumed by our subsidiaries in the US, Germany and UK, they are office-based with limited domestic water use. Therefore, WNC’s water risk management will focus primarily on our sites in China and Mexico to minimize the risk of business interruptions due to water shortages.
| Climate Scenarios | Corresponding IPCC AR6 pathway | Timeframe |
|---|---|---|
| BAU (Business as Usual) | The SSP3-RCP7.0 scenario. It assumes low climate policy intervention, representing a medium-high radiative forcing pathway. | Short term: from 2015 to 2045 Mid term: from 2035 to 2065 Long term: from 2065 to 2085 |
| OPT (Optimistic) | The SSP1-RCP2.6 scenario. It assumes that the global temperature increase is less than 2 °C by the end of this century, representing a low radiative forcing pathway. | |
| PES (Pessimistic) | The SSP5-RCP8.5 scenario. It assumes a future heavily reliant on fossil fuels, representing a high radiative forcing pathway. |
- Note: According to the global water stress data published by the World Resource Institute (WRI), water stress risk levels are classified as Low (<10%), Low-Medium (10–20%), Medium-High (20–40%), High (40–80%), and Extremely High (>80%).
Recycling and reuse of water resources
Tap water is WNC’s main source of water. Water for everyday use comprises the majority of water usage, with a small part comprising of water used by factory equipment and special manufacturing processes.
In 2023, the mechanical water meters within our sites in China were upgraded to smart meters. This upgrade not only significantly reduces manual meter reading tasks but also enhances monitoring efficiency, allowing us to monitor water usage in real-time and promptly identify leaks.
In 2024, the Vietnam site began installing smart water meters at major water withdrawal locations, water usage hotspots, and water recycling points. The site has made plans to modify its energy management system so that it can display water usage, amount of water recycled, and other water-related data to facilitate monitoring and analysis of water usage hotspots. In addition, the S1 site has implemented a two-year water conservation project. In the first phase of this project, a pre-treatment and RO membrane system was built, focusing on processing used pure water from manufacturing processes and water from cooling towers. The system recycles an estimated 64.8 million liters of water annually, allowing the site to achieve an 85% recycling rate for water used in manufacturing processes and an overall water recycling rate of 70%. Phase two of this project began in 2025, focusing on recycling wastewater produced during manufacturing processes. The systems built in phase two can recycle an estimated 14.60 million liters of water annually. These efforts support SDG 6 by promoting efficient water use, enhancing water resource management, and advancing sustainable water practices.
WNC’s Water Usage in the Most Recent Four Years Note 1 (Unit: megaliters Note 5)
| Item | 2021 | 2022 | 2023 | 2024 | |
|---|---|---|---|---|---|
| Water withdrawal (A) | Tap water | 421.742 | 502.103 | 584.443 | 542.048 |
| Groundwater Note 2 | 32.173 | 0 | 0 | 0 | |
| Surface water | 30.813 | 28.608 | 99.1258 | 122.529 | |
| Total water withdrawn (A) | 484.728 | 530.711 | 683.568 | 664.577 | |
| Water discharge (B) | 202.621 | 300.858 | 356.832 | 531.662 | |
| Water consumption (A-B) | 282.107 | 229.853 | 326.736 | 132.915 | |
| Water withdrawal intensity Note 3 | 6.75 | 5.27 | 5.28 | 4.92 | |
- Note 1: Water withdrawal data is based entirely on meter readings provided by the water supply companies. For the years 2021 to 2023, wastewater discharge was calculated using actual meter readings for the Taiwan sites, while estimates for overseas sites were based on the proportion of sewage treatment fees to tap water fees. Starting in 2024, all site discharge volumes are uniformly calculated as 80% of water consumption, in accordance with the Sewerage Management Regulations of Science Parks.
- Note 2: From 2019 to 2021, WNC’s first Vietnam site used underground water. In 2022, all production lines in Vietnam were relocated to the newly built Vietnam site, and tap water was adopted as the water source.
- Note 3: Water withdrawal intensity is obtained by dividing the amount of water withdrawn (excluding recycled water) by consolidated revenue (NT$ million).
- Note 4:The global water withdrawal/discharge/consumption data coverage 6 out of 7 global production sites with a coverage rate of 85.71%.
- Note 5:1 million liters = 1,000 cubic meters = 0.001 million cubic meters.
Amount of water recycled at WNC in the most recent four years Note 1(Unit: megaliters)
| Item | 2021 | 2022 | 2023 | 2024 |
|---|---|---|---|---|
| Tap water | 28.445 | 17.413 | 36.415 | 24.578 |
| Groundwater | 0.62 | 0 | 0 | 0 |
| Surface water | 30.813 | 28.608 | 99.125 | 122.529 |
| Other | 23.469 | 26.556 | 41.221 | 55.114 |
| Total water recycled | 83.347 | 72.577 | 176.761 | 202.221 |
| Water recycling rate Note 2(%) | 17.19 | 13.68 | 25.86 | 30.43 |
- Note 1: Tap water recycling includes drinking fountain RO, wastewater recycling and water recycled from production processes; surface water recycling includes water recycled from air conditioning systems and rainwater recycling (estimated using the volume of water in the rainwater tank, as well as daily rainfall statistics provided by the Central Weather Administration); and other recycled water includes cooling water.
- Note 2: Water recycling rate is calculated by dividing the total volume of water recycled by the total water usage (tap water + groundwater + surface water).
Wastewater Management
The S1 site is the only site with washing processes that generate wastewater. Wastewater from sites other than S1 is mainly wastewater from everyday use. In response to the increase in generated wastewater due to production site expansion, wastewater treatment equipment was installed at S1 in 2020, and wastewater processing permits were obtained in 2021. Water discharge monitoring instruments were installed at the site to ensure that the wastewater complies with the water quality management regulations of the Hsinchu Science Park’s sewage system. Every six months, WNC contracts an inspection agency approved by the National Environmental Research Academy to test the water discharged by WNC to ensure that said discharge meets wastewater discharge standards.
Waste Management
In accordance with SDG 11, WNC’s waste sources include raw materials used in production (such as electronic parts, mechanical parts, and packaging materials), and wood, plastics and paper generated during production processes. In order to realize resource recycling goals and reduce environmental impact, WNC promotes green product design to reduce waste generation. Through cooperation with our supply chain, we promote the reuse of incoming packaging materials, and continue to optimize resource classification management procedures to ensure efficient resource use. WNC continues to look for more reuse and recycling methods that comply with legal regulations and achieve the goal of reducing waste.
In order to effectively manage waste generation and comply with the environmental management system ISO 14001, WNC has set up waste management indicators at each site, and manages and tracks the waste situation through the environmental data platform to monitor indicator status. If any abnormalities are found in the indicators, the composition ratio of waste from each process or production source will be analyzed to check whether there is still room for improvement in waste resource recycling within the organization or whether there is abnormal waste generation, and management measures are implemented when necessary.
In 2024, 6,848.43 tonnes of waste from operations were produced, and the waste generation intensity was 0.007 tonnes/million NT$. The waste recycling rate increased to 88.75%, reaching our goal of 87% for the year and showing that our continuous efforts in waste management and recycling have achieved clear results.
Waste Management Performance in the Most Recent Four Years Note 1
| Category | Unit | 2021 | 2022 | 2023 | 2024 |
|---|---|---|---|---|---|
| Waste generation intensity Note 2 | Tonnes/ million NT$ |
0.013 | 0.01 | 0.008 | 0.007 |
| Waste generation intensity reduction
Base Year: 2021 |
% | 0 | -20.03 | -41.90 | -46.46 |
| Total recycling rate Note 3 | % | 80.85 | 83.62 | 87.30 | 88.75 |
- Note 1: The scope of these statistics cover WNC headquarters, S1, S3, WNC (Kunshan), Wistron NeWeb (Kunshan), WebCom Communication (Kunshan), and the Vietnam site.
- Note 2: In 2024, the formula for calculating waste generation intensity was modified. The current formula uses “total waste generated during the year” as the numerator, which is then divided by WNC’s consolidated revenue for the year. The data for the past four years has also been revised accordingly.
- Note 3: Total recycling rate is calculated by dividing the amount of waste recycled by the total waste generated; the definition of recyclable waste is based on the local regulations where sites are located.
Waste Generated in the Most Recent Four years and Relevant Handling Methods Note Unit: Tonnes (t)
| Category | 2021 | 2022 | 2023 | 2024 | |||||||||
|---|---|---|---|---|---|---|---|---|---|---|---|---|---|
| General waste | Hazardous waste | Total | General waste | Hazardous waste | Total | General waste | Hazardous waste | Total | General waste | Hazardous waste | Total | ||
| Waste recyclin | Recycling and reuse | 3,456.62 | 248.89 | 3,705.51 | 4,899.55 | 177.92 | 5,077.47 | 5,463.94 | 310.52 | 5,774.46 | 5,799.95 | 278.11 | 6,078.07 |
| Waste disposal | Landfill | 26.49 | 0 | 26.49 | 0 | 0 | 0 | 0 | 0 | 0 | 0 | 0 | 0 |
| Incineration (with energy recovery) | 145.17 | 0 | 145.17 | 112.51 | 0 | 112.51 | 636.79 | 16.44 | 653.24 | 680.4 | 70.42 | 750.82 | |
| Incineration (without energy recovery) | 604.76 | 94.91 | 699.67 | 766.78 | 108.56 | 875.34 | 121.65 | 65.46 | 187.11 | 6.97 | 8.24 | 15.21 | |
| Other disposal methods | 0 | 6.36 | 6.36 | 0 | 6.69 | 6.69 | 0 | 0 | 0 | 0 | 4.33 | 4.33 | Total | 4,233.04 | 350.16 | 4,583.2 | 5,778.84 | 293.17 | 6,072.01 | 6,222.38 | 392.42 | 6,614.81 | 6,487.32 | 3611.11 | 6,848.43 |
- Note: Due to a miscalculation of the figures for Taiwan sites in 2022, the amount of general business waste categorized as recycled or reused has been corrected from 4,852.26 tonnes to 4,899.55 tonnes.
Waste Reduction Hotspot Analysis and Resource Recycling Project
WNC regularly tracks and manages the waste output structure and improves waste raw material removal methods. In terms of process waste, we continue to promote off-site reuse plans for solder dross, solder paste plastic containers, epoxy resin, and printed circuit board metal scraps. In terms of raw material packaging materials and containers, such as plastic trays, outer packaging cardboard boxes and Styrofoam boxes are negotiated with suppliers, requiring manufacturers to reuse them to achieve waste reduction, and the scope of negotiations is gradually expanded. For production consumables and test equipment, systematic usage and waste management has been implemented. In addition, inspection and maintenance processes have been added to extend the lifespan of consumables. When recycling metals, we classify them by their value (precious metals, general metals) to create higher recycling benefits. For waste materials that cannot be reused, such as electrostatic bags, we promote the conversion of waste heat into energy. In 2024, about 3,224.80 tonnes of recycled resources were obtained through resource recycling projects, and recycling revenue reached NT$41.12 million. It is estimated that this can reduce emissions by approximately 1,169.93 tonnes of CO2e in the value chain. Based on the Report on the Social Cost of Greenhouse Gases published by the U.S. Environmental Protection Agency in 2023, and applying a 2% discount rate, the aforementioned reduction amount is equivalent to reducing social costs by approximately US$0.22 million, or NT$7.29 million.
To help prevent environmental damage caused by waste incineration or burial, increase waste diversion rates, and reduce resource waste and waste disposal costs, we implemented the standards in UL 2799’s Zero Waste to Landfill validation program at our production sites in China and Vietnam in 2024. Interviews with employees at these sites were conducted to identify the flow of waste at the site and look for areas that can be improved upon, and they also underwent training to enhance their knowledge regarding waste classification, reduction and reuse. In 2025 the Vietnam site obtained a platinum rating in the aforementioned UL 2799 program, with a landfill waste diversion rate of 100%; seven percent of the waste diverted was processed through incineration with energy recovery. The measures implemented at these sites will be implemented at all other sites in the future to fulfill our commitment to waste management.
2024 WNC circular economy promotion results
| Category | Measures | Waste recycling Tonnes (t) | Waste recycling benefits (Unit: thousand NT$) | Carbon reduction (tonnes CO2e)Note |
|---|---|---|---|---|
| Solder waste | Recycle solder waste generated during production processes for recycling vendors to turn into electroplated plates. | 18.34 | 13,980.4 | 6.6 |
| PCB trim scraps | Provide PCB trim scraps generated during production processes to recycling vendors for them to recycle heavy metals (such as copper and gold). | 191.8 | 14,511.1 | 69.05 |
| Used pallets | Provide unusable pallets to recycling vendors to remanufacture into fuel balls. These are used by cogeneration plants as combustion aids. | 437.31 | - | 157.43 |
| Empty solvent barrels and solder paste plastic containers | Provide empty plastic containers to recycling vendors for washing and processing. The containers are then broken up into plastic pellets which can be remanufactured into other plastic items. | 7.95 | - | 2.86 |
| Waste paper and waste cardboard boxes | Cooperate with recycling vendors to produce recycled pulp from waste paper. | 1,920.19 | 765.75 | 691.27 |
| Scrap plastic trays | Scrap plastic trays from production lines are sent to recycling vendors for sorting and recycling. | 440.11 | 497.88 | 158.44 |
| Scrap styrofoam | Scrap styrofoam packing material is sent to recycling vendors and turned into styrofoam balls for reuse. | 2.23 | - | 0.8 |
| Waste activated carbon | Waste activated carbon is sent to recycling vendors for desorption procedures to regenerate activated carbon materials. | 12.74 | - | 4.59 |
| Epoxy resin | Epoxy resin is sent to waste disposal vendor as raw material for wood-plastic board production. | 3.37 | - | 1.21 |
| Other Note 1 | Waste packing tape and other mixed plastics are sent to recycling vendors to produce solid renewable fuels. | 190.76 | - | 68.67 |
| Total | 3,224.8 | 41,127.7 | 1,160.93 | |
- Note 1: The amount of carbon reduction achieved through waste recycling is calculated based on the waste incinerated services (Gangshan Refuse Incineration Plant) coefficient announced on the Carbon Footprint Information Platform (this coefficient was 360 kgCO2e/tonne in 2020). The calculation formula is recycling volume (tonnes) × 0.36.
Biodiversity
Natural-related Financial Disclosures
In 2023, WNC formulated the WNC Biodiversity and No Gross Deforestation Commitment , showing its commitment to protecting natural ecosystems. The commitment also calls on suppliers and partners in the value chain to join in responding to the UN’s SDGs, taking responsibility to mitigate the overall impact on the ecological environment. We are also implementing the Mitigation Hierarchy, which comprises steps such as avoidance, minimization, restoration, and offsetting, to implement initiatives that promote biodiversity, zero deforestation, and reforestation. Our goal is to achieve Net Positive Impact, No Net Loss, and No Gross Deforestation by 2050.
In the same year, we also joined the Taiwan Nature Positive Initiative (TNPI) launched by the World Business Council For Sustainable Development (WBCSD). We aim to utilize the resources and tools provided by this organization to examine our own operational impact on the environment. Additionally, we plan to organize workshops , providing a platform for employees to exchange ideas and discussions, in order to build consensus within our company on ecological conservation.
In 2023, WNC used the Biodiversity Risk Filter (BRF), a tool developed by the World Wildlife Fund (WWF), to conduct preliminary assessments on the company’s dependency and impact on natural ecosystems. It also referenced guidelines provided by the Taskforce on Nature-related Financial Disclosures (TNFD) to implement the LEAP (Locate, Evaluate, Assess, Prepare) risk assessment approach. To accelerate nature-related risk assessment and disclosure, WNC applied to join the TNFD Forum in 2024 and became a TNFD Adopter, committing to publishing a WNC TCFD & TNFD Report in 2025 that is based on TNFD guidelines. For more details, please refer to WNC’s Climate- and Nature-related Financial Disclosure Report.
Ecological Monitoring
WNC has paid greater attention to biodiversity issues in recent years. In 2023, it began to implement an industry-academia partnership program with National Taiwan University. This not only mobilizes employees to participate in activities such as tree planting and ecological surveys, but also develops forest carbon sinks. WNC also conducts an annual species survey in its adopted forest land. We hope to track the positive impact of this project on the environment through long-term monitoring, while also raising employees’ awareness of ecological conservation and achieving the purpose of environmental education.
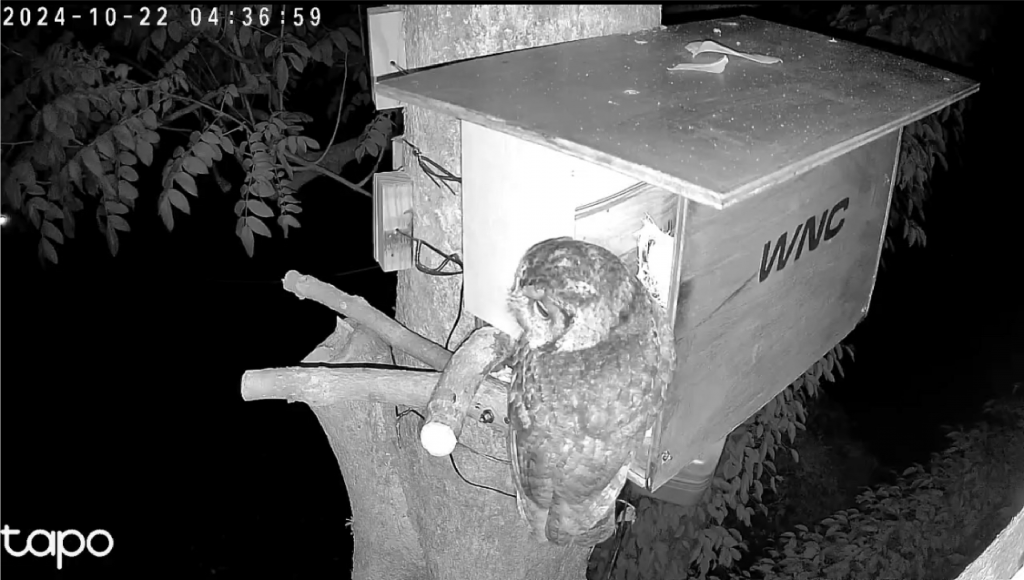
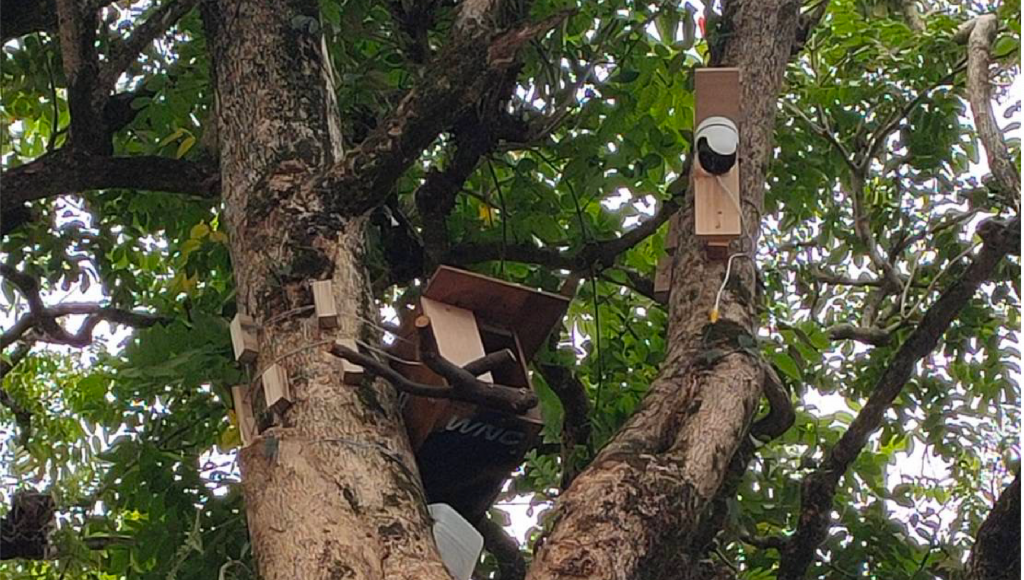
Creating Homes for Owls: WNC employees build nest boxes to protect biodiversity
As an apex species in the food chain, owls serve as an important indicator of habitat health and biodiversity integrity. However, urban development and forest fragmentation have led to a significant decline in the number of natural tree cavities, severely impacting the breeding and survival of the Collared Scops Owl, who build their nests in these cavities. To take meaningful conservation actions and respond to global biodiversity initiatives, in 2024 employees from WNC’s Mechanical and Industrial Design Division organized the Creating Homes for Owls event. These employees and their family members used their expertise in design to build environmentally-friendly nest boxes in collaboration with locals.
In 2024, two sessions of the Creating Homes for Owls event were held at the Living Old House venue in Hsinchu County, and a total of 56 people participated in these sessions. Through a lecture on the characteristics and behaviors of the Collared Scops Owl, a plaster mold DIY activity, and a hands-on workshop on making nest boxes, participants gained a deeper understanding of wildlife behavior and the threats they face, which helped enhance participants’ awareness and commitment to environmental conservation.
A total of 10 nest boxes were made during this event, seven of which were donated to schools and environmental organizations in the Hsinchu area, including Xinfeng Junior High School, Taiping Elementary School in Guanxi Township, Pinglin Elementary School in Guanxi Township, Dadu Elementary School in Hengshan Township, TreeFood Space, and the Society of Wilderness. This event helped promote grassroots ecological education and expanded community impact. It also helped us progress toward our ESG and sustainability goals by integrating biodiversity conservation into our corporate culture and demonstrating our steadfast commitment to sustainable development.